新航道雅思小编分享雅思小作文静态图:四个国家的发电方式。每一篇范文都经由专业团队反复校对,最终外教审查定稿。
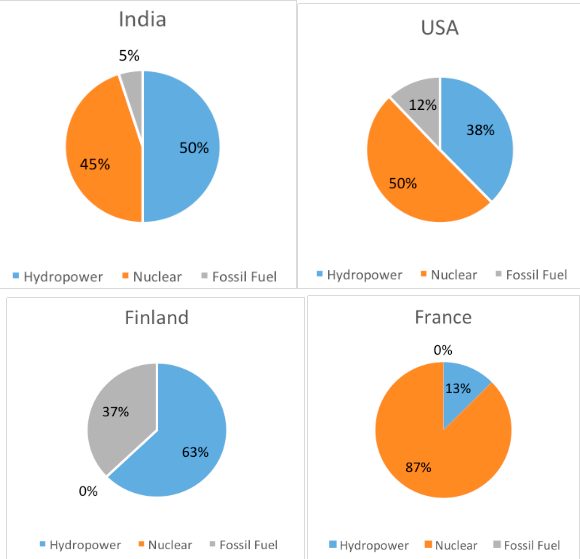
The charts below show the source of electricity produced in four different countries in 2020.
类型:静态图——多饼图
写作注意点:分段合理性、饼图之间的比较
The pie charts illustrate the proportion of electricity generated in three different ways by four countries in a particular year.
【开头段:概括图表主要内容,通过同义替换改写题目。】
Overall, all the four countries were dependent on clean energy such as hydropower and nuclear energy, while fossil fuel was not widely applied in most of them.
【总结段:概括图表突出特征。本图表主要体现了四个国家在发电中对清洁能源的依赖程度较高,而对传统的化石燃料使用较少。】
Hydropower was responsible for a major part of electricity generated in Finland and India. In Finland, a whopping 63% of electricity was produced in this way, which was slightly higher than that in India (50%). Fossil fuel was still accountable for the remaining 37% in this country while only a mere 5% was supplied by this source in India. Notably, people from India also made use of nuclear energy to supply 45% of their electricity, but Finlanders did not use this source at all in this process.
【主体段1:芬兰和印度的发电方式比较。二者的水力发电占比较高,因此分为一段】
Some different situations can be found in USA and France, where a greater part of electricity was yielded through the use of nuclear energy. It seems that France relied heavily on it, with 87% of electricity produced in this way. Nuclear was also a principal source for the USA (50%), and hydropower ranked the second (38%), almost tripling its proportion in France. French people depended totally on clean energy, while users from the USA still obtained 12% of electricity by burning fossil fuel.
【主体段2:美国和法国的发电方式比较。二者都对核能发电依赖程度较高,因此分为一段。】
【责任编辑】:长沙新航道小编 版权所有:转载请注明出处
如本网转载稿、资料分享涉及版权等问题,请作者见稿后速与新航道长沙学校联系,我们会第一时间删除.