长沙新航道雅思写作小编分享雅思小作文示范写作动态柱图:不同行业女性员工比例。每一篇范文都经由专业团队反复校对,最终外教审查定稿。成功就是日复一日那一点点小小努力的积累。
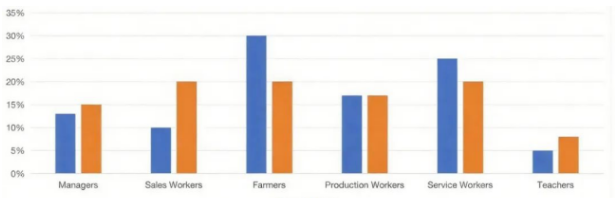
The chart below shows the percentage of woman working in different fields in 2007 and 2009.
主体段分段:按照<变化幅度>分段
Body 1:Farmers、Service Workers、Sales Workers(幅度大)
Body 2:Teachers,Managers,Production Workers(幅度小)
开头段
The bar chart compares the proportion of females working in six different sectors in 2007 and 2009.
概述段
Overall, farming was the the most common occupation for women in both years, whereas teaching attracted the smallest proportion of female staff. The percentage of females employed in manufacturing remained unchanged, while the other sectors showed varying trends.
思路要点:
- 两年中farmers数值都最高,teachers数值都最低
- 只有production
- production workers数值不变,其他行业数值呈现不同的变化趋势
Body paragraph 1
It is clear that three out of the six fields exhibited remarkable changes in the percentage of female workers. Although farming remained the leading sector for female employment, its proportion dropped significantly from 30% in 2007 to 20% in 2009. The figure for female service workers saw a less drastic fall to 20% during the same period, a decrease of 5%. In contrast, the percentage of female sales employees saw a twofold increase, reaching 20% in 2009.
思路要点:
- 三个行业数值变化显著
- farmers:数值始终最高,但从2007年的30%显著下降到2009年的20%
- service workers:下降了5%到2007年达到20%
- sales workers:上涨两倍达到20%
Body paragraph 2
However, the remaining three sectors showed modest changes. The teaching sector consistently employed the smallest percentage of women, with the figure rising slightly from 5% in 2007 to 8% in 2009. An upward trend was also observed in managerial positions, where the proportion of female staff climbed marginally from 12% to 15%. Meanwhile, the manufacturing industry witnessed no changes, with the percentage of females remaining stable at 17% throughout the two-year period.
思路要点:
- teachers:两年数值都最低,从5%小幅上升到8%
- managers:小幅上升到2007年达到15%
- production workers:平稳在17%
【责任编辑】:长沙新航道小编 版权所有:转载请注明出处
如本网转载稿、资料分享涉及版权等问题,请作者见稿后速与新航道长沙学校联系,我们会第一时间删除.