The table below gives information about the amount of tax collected (as % of GDP) in five
countries for 4 years between 1975 and 2005.
主体段分段方法:按照<变化幅度>分段
Body 1:Sweden、USA(幅度较小)
Body 2:Korea,Japan,Turkey(幅度较大)
开头段
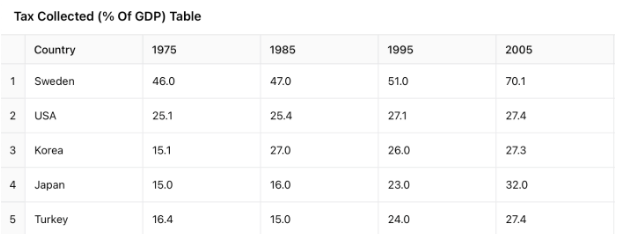
The table compares tax revenues(recorded as a percentage of GDP) across five nations in four different years: 1975, 1985, 1995 and 2005.
概述段
Overall, all the five countries had witnessed an increase in their tax revenue, with Sweden consistently having the highest figures among them. The most drastic increase in tax collection was observed in Japan.
思路要点:
- 五个国家数值都上升
- Sweden数值始终最高
- Japan数值变化最显著
Body paragraph 1
Looking at the information in more detail, we can see that Sweden topped the list in terms of tax revenue throughout the years, with the figure rising significantly from 46% in 1975 to 70.1% in 2005. In contrast, the tax revenue in USA remained relatively stable, increasing only slightly from 25.1% to 27.4% during the same period.
思路要点:Sweden,USA
- Sweden:数值始终最高,1975年46%→显著上升,2005年达到70.1%
- USA:数值相对平稳,从25.1%小幅度上升到27.4%
Body paragraph 2
The other three countries experienced more noticeable growth in tax share. Japan, in particular, saw its tax collection more than double from 15.1% in 1975 to 32% in 2005. Korea's tax-to-GDP ratio also started at 15.1% in 1975, after which this figure experienced a modest rise with a period of fluctuations to 27.3% in 2005. Meanwhile, the tax revenue in Turkey initially dropped slightly to 15% in 1985, but it then saw a dramatic rise to 27.4% by 2005, matching the USA's tax ratio.
思路要点2:Japan,Korea,Turkey
- 其余三个国家数据变化显著
- Japan:变化最大,1975年15.1%→上涨了两倍多,2005年达到32%
- Korea:1975年为15.1%→随后小幅度上升伴随波动,2005年达到27.3%
- Turkey:1985年小幅度下降到15%→随后急剧上升,2005年达到27.4%,等同于同年USA数值
【责任编辑】:长沙新航道小编 版权所有:转载请注明出处
如本网转载稿、资料分享涉及版权等问题,请作者见稿后速与新航道长沙学校联系,我们会第一时间删除.