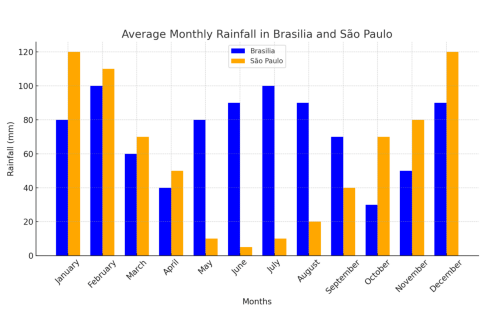
The chart below illustrates the average monthly rainfall in two cities in Brazil, Brasilia and S?o Paulo, measured in millimetres.
分段方法:
方法1:按照<时间>分段
- Body 1:1月~4月
- Body 2:5月~12月
开头段
The bar chart compares the monthly rainfall (measured in millimeters) of two Brazilian cities, Brasilia and S?o Paulo, over the course of one year.
概述段
Overall, while the precipitation in S?o Paulo shows significant fluctuations, Brasilia experiences a more consistent pattern. The most notable difference between the two cities occurs from May to August.
思路要点:Canada、UK
- S?o Paulo降雨量变化显著,但Brasilia降雨量相对均匀
- 两个城市降雨量在5月~8月差距显著
Body paragraph 1
During the first 4 months, S?o Paulo receives more precipitation than Brasilia. Specifically, S?o Paulo records 120mm of rainfall in January, surpassing Brasilia by 40mm. However, Brasilia’s rainfall rises significantly in February, narrowing the gap between the two cities to just 10mm. The period from February to April experiences a steady decline in the rainfall of both cities, with S?o Paulo continuing to receive slightly more precipitation than Brasilia.
思路要点:1月~4月
- 1月到4月都是So Paulo降雨量超过Brasilia
- 1月:So Paul降雨量为120mm,比Brasilia多40mm
- 2月:Brasilia降雨量增多,两个城市间差距缩小为10mm
- 2月到4月:两个城市降雨量都持续下降
Body paragraph 2
From May onwards, Brasilia’s rainfall surpasses that in S?o Paulo, peaking at 100mm in July. Following a sharp decline to the lowest level at 30mm in October, it increases threefold to 90mm by December. In contrast, the rainfall in S?o Paulo plunged to only 3mm in July, before rising drastically to 120mm in December, overtaking the figure in Brasilia in October.
思路要点:5月~12月
- Brasilia:降雨量在5月超过S?o Paulo→到7月达到峰值100mm→10月急剧下降到最低值30mm→12月上涨3倍达到90mm
- S?o Paulo:到7月急剧下降到3mm→随后到12月急剧上升到12mm,其中在10月超过Brasilia的降雨量
【责任编辑】:长沙新航道小编 版权所有:转载请注明出处
如本网转载稿、资料分享涉及版权等问题,请作者见稿后速与新航道长沙学校联系,我们会第一时间删除.