The chart below shows the share of total world production in three regions from 1840 to 2000.
【主体段分段】:按照<变化幅度>分段
Body 1:Asia、Europe(变化幅度较大)
Body 2:Rest of world(变化幅度较小)
开头段
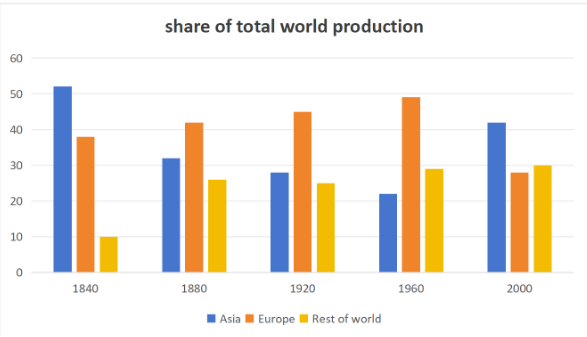
The bar chart demonstrates changes in production shares of Asia, Europe and the rest of the world between 1840 and 2000.
概述段
It is clear that for most time of the period, the rest of the world contributed the smallest share to global production, although this was the only region that experienced a steady increase over time.
思路要点:
- Rest of world数据一致最低
- 只有Rest of world数据整体呈现上升趋势
Body paragraph 1
Initially, Asia dominated global production, accounting for 52%. After a significant fall to 21% in 1960, this figure doubled in 2000. By contrast, Europe’s production share grew gradually from 38% to a peak of 48% between 1840 and 1960, overtaking Asia’s share in 1980. The final 4 decades witnessed a dramatic drop in this figure by 20% in 2000.
思路要点:(蓝色)Asia、(橙色)Europe
- (蓝色)Asia:第一年数据最高,占比52%→到1960年显著下降到21%→到2000年涨了2倍
- (橙色)Europe:1840年为38%→持续上升,到1960达到48%,其中在1980年与Asia数据有交点→到2000年急剧下降了20%
Body paragraph 2
Unlike Asia and Europe, such significant changes in production were not found in other areas of the world. Beginning at 10% in 1840, the production share from the rest of the world almost tripled to 28% in 1880, after which there was a period of stability until 1920. Subsequently, this figure experienced a slight climb by 2% over the last 80 years, surpassing Asia’s share in 1960.
思路要点:(黄色)Rest of world
- 变化幅度较小
- 1840年为10%→1880年几乎上涨了3倍达到28%→到1920年保持平稳→到2000年小幅度上升了2%,其中1960年超过Asia的数据
【责任编辑】:长沙新航道小编 版权所有:转载请注明出处
如本网转载稿、资料分享涉及版权等问题,请作者见稿后速与新航道长沙学校联系,我们会第一时间删除.