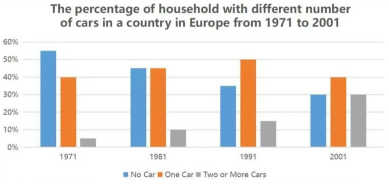
The chart below shows the percentage of household with different number of cars in Europe from 1971 to 2001.
【主体段分段】:
<方法1>:按照时间分段(本篇文章采取此种分段方法)
<方法2>:按照类别分段
【开头段】
The bar chart illustrates changes in the number of cars per household in Europe between 1971 and 2001.
【概述段】
It is clear that in the given 3 decades, car ownership increased in Europe. However, the proportion of families with two or more cars remained the smallest throughout the period.
语言点提示:生活化描述
思路要点:
- 除了no car之外,其他两个类别上升→汽车拥有率↑
- 有多于2辆车的家庭比例一直最低
【Body 1】
We can see that in the initial year, roughly half of the families did not have a car. Although 40% of households had one car, it was uncommon for families to own two or more cars.
思路要点:第一年数据对比
- no car:大约一半
- one car:40%
- two or more cars:数值非常低
【Body 2】
In the subsequent 30 years, the figure for families with no car was on a constant decline, falling remarkably to 30% in 2001. By contrast, the 30-year period witnessed a gradual growth in the percentage of households with more than one car to 30%. The proportion of one-car families climbed slightly to 45% in 1981, and then it overtook the figure for households without a car. After peaking at 50% in 1991, this figure saw a marginal drop by 10% in the final year.
思路要点:后续年份
- no cars:持续下降
- tow or more cars:逐步上升
- one car:小幅度上升→1981年超过one car→小幅度
【责任编辑】:长沙新航道小编 版权所有:转载请注明出处
如本网转载稿、资料分享涉及版权等问题,请作者见稿后速与新航道长沙学校联系,我们会第一时间删除.