The chart shows the percentage of people who were satisfied with the health care system from 1971 to 2007.
【主体段分段】:
【方法1】:按照[时间]分段
【方法2】:按照[国家--趋势]分段(本篇文章采取此种分段思路)
【开头段】
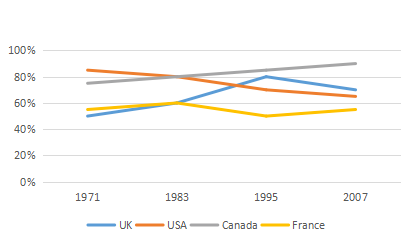
The line graph compares the rate of people’s positive feedback to healthcare systems in UK, USA, Canada and France between 1971 and 2007.
【概述段】
Overall, the overall degree of satisfaction towards the medical system in Canada and UK showed an upward trend, while the figures in the other two countries witnessed a downward trend.
思路要点:
Canada和UK整体上升,其余2个国家趋势整体↓
【Body 1】
Looking at the information in more detail, we can see that the satisfaction rate in USA ranked the top in the initial year(roughly 84%), followed by a noticeable drop by 20% in the following 36 years. By contrast, the figure in Canada saw a constant rise from 78% in 1971 year to nearly 94% in the final year, overtaking the figure in USA in 1983.
思路要点:
- USA:最开始最高→随后显著下降
- Canada:平稳上升,1983年超过USA
【Body 2】
We can also see that although only around half of the surveyed people in UK and France were satisfied with the medical service in the original year, this figure ascended to 60% in 1983. Subsequently, the rate of satisfaction in UK exceeded that in France and climbed remarkably to the peak at 81% in 1995, before falling marginally by 5% in 2007. The satisfaction rate in France, however, witnessed a slight decline to around 46% in 1995, after which the last 12 years experienced a slow growth by 2%.
思路要点:
1-1971年UK和France大约50%,随后在1983年上升到60%
2-随后,UK超过France→显著上升→轻微下降
France:小幅度下降→轻微上升
【责任编辑】:长沙新航道小编 版权所有:转载请注明出处
如本网转载稿、资料分享涉及版权等问题,请作者见稿后速与新航道长沙学校联系,我们会第一时间删除.