The graph below shows the employment of women between 16 and 65 years old in five countries from 2003 to 2009.
主体段分段:按照<数值大小>分段
开头段
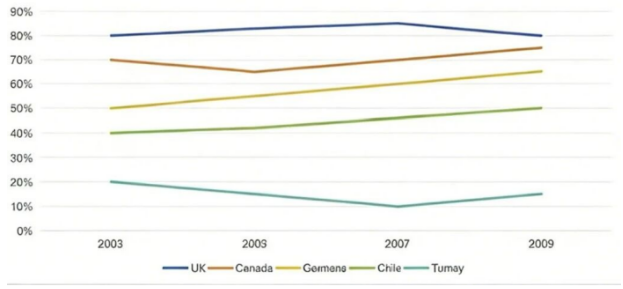
The line graph illustrates changes in the percentage of employed females across five countries (the UK, Canada, Germany, Chile and Turkey) between 2003 and 2009.
概述段
Overall, the UK consistently had the highest proportion of women in employment, while Turkey recorded the lowest. Additionally, women in Germany experienced the most notable growth in labor force participation during the given period.
思路要点:
- UK数值一直最高,Turkey数值一直最低
- Germany数值变化幅度最大
Body paragraph 1
In 2003, 80% of women in the UK were employed. After a marginal growth to 85% in 2007, this figure returned to its original level of 80% in 2009. By contrast, Canada’s employment rate saw a slight decline from 70% in 2003 to 65% in 2005, before rising steadily to 75% by 2009. Although just half of German women were employed in 2003, there was a significant increase to 65% six years later.
思路要点:
- UK:2003年为80%→随后小小幅度上升到2007年达到85%→随后到2009年回落至80%
- Canada:2003年到2005年小幅度下降(70%到65%)→到2009年持续上升到75%
- Germany:2003年数据为50%→随后显著上升到2009年达到65%
Body paragraph 2
In comparison to the UK, female workforce participation in the other two countries remained lower. Specifically, Chile witnessed a gradual rise, with the percentage of employed women growing from 40% in 2003 to 50% by 2009. Conversely, in Turkey, the employment rate halved to 10% in the first four years, followed by a modest increase to 15% by 2009.
思路要点:其余两个国家数据较低
- Chile:2003年到2009年逐步上升,从40%上升到50%
- Turkey:2003到2007年数据减半到10%→随后小幅度上升到2009年达到15%
雅思小作文上分Tips
小作文看着简单,但写起来却常常遇到这些问题:概括句总觉得空、不知道写哪组对比;模仿范文也写了不少,但分数始终卡在6……
这类问题其实不是“基础差”,而是缺少系统的表达框架+语言训练。暑假是集中突破小作文表达力的黄金阶段,新航道写作课程会重点带你:
读图、概括、分段,掌握各类图表写作结构;
词组句型反复练,解决“不会写”或“太单薄”;
真题图表逐句拆解+精批,稳步提升语言准确度。